
Pipeline Forecast Visual
Generate a forecast to predict when subjects will successfully complete a process.
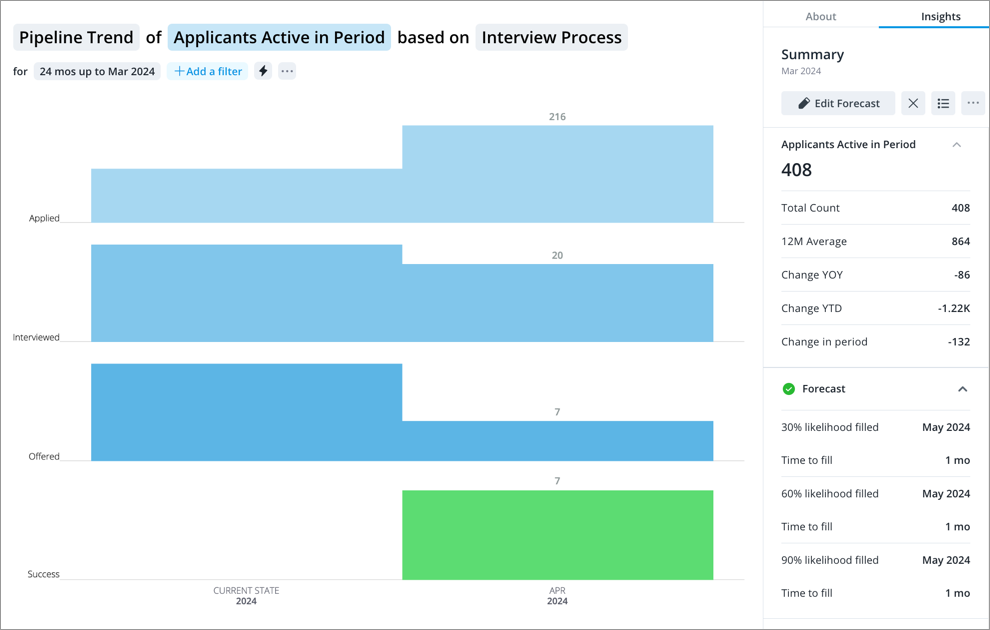
The pipeline forecast allows you to project the time to fill for open positions at a set confidence level. For example, you are looking to hire three senior java developers in the Seattle area and use the pipeline forecast to see how long it will take to fill the open positions. The pipeline forecast projects that the three open positions will be filled in 7 weeks or less, with a likelihood of 60 percent.
The pipeline forecast delivers a projection based on the simulated movement of applicants through the talent acquisition pipeline. These simulations are based on the number of active applicants in the pipeline and historical data (that is, calculated conversion rates between stages, transition time distributions between stages, and the rate of new applications).
Pipeline forecast model
The forecast is based on the following observations:
- Conversion rates: The ratio of applicants that move from one stage to another.
- Duration in stage distributions: The list of times that applicants remained in a stage before moving to another stage.
- Rate of new applications: The number of new applicants entering the first stage of the pipeline each day.
- Active applicants: The number of active applicants in each stage.
Note: We only use the historical data that is visible in the Pipeline Trend visual to generate these observations. Extending the time window that is shown in the chart will affect the observations.
These observations are combined in a computational model based on a Markov chain, as described in the following example.
Note: The mathematical model for movement through the pipeline is a semi-Markov process. The movement of an applicant in a particular stage is realized as a random process with the conversion rates for that stage defining the probability of reaching the other stages.
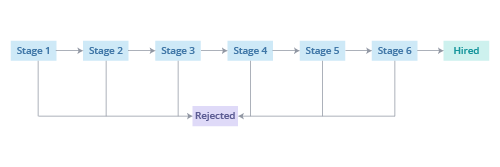
Example: Let's assume that applicants can only progress to the next stage or be rejected, as shown in the following illustration.
The movement of the current applicants through the pipeline is simulated as random processes and calculated based on the measured conversion rates and times in stage before transitions. Let's take a look at how this process works for the applicants in Stage 1. Based on the historical conversion rates, each applicant in Stage 1 has a 30 percent change of progressing to Stage 2 and a 70 percent chance of being rejected, as shown in the following illustration.
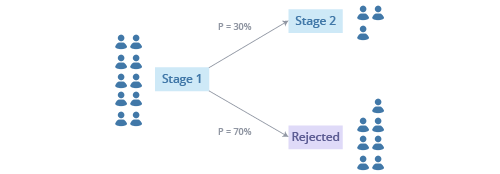
Once a path is chosen (Stage 1 to Stage 2 or Stage 1 to Rejected), a time for the transition is generated based on the historical duration times in stage between the chosen transition. Applying this process to all applicants in all stages, Visier is able to simulate the movement in the pipeline for a defined time range.
New applicants at the first stage of the pipeline are generated by using the historical rate of new applications. The movement of these new applicants through the pipeline is calculated in the same way as the current active applicants.
This simulation is repeated many times so that each applicant gets a large number of chances to (a) progress to higher stages and (b) have different duration times between the transitions. The forecast results are calculated from the set of simulated outcomes.
Accuracy of the pipeline forecast
The accuracy of the forecast is based on two factors:
- The number of simulations that were available to calculate the forecast results.
- The quantity and relevance of historical movement through the pipeline that was used to calculate the conversion rates and duration time distributions.
A large number of simulations are necessary to generate high quality forecast results. We add more simulations dynamically until reliable forecasts are created. Only reliable forecast results are displayed in the solution.
The forecast is based on historical recruitment data, and results can only be considered reliable, if the historical dataset of movement through the pipeline is large enough to allow insights on realistic conversion rates. As a rule of thumb, a forecast only yields reliable results if data on three historical hires is available for every open position. Visier uses a sophisticated analyses mechanism to evaluate whether sufficient historical data is available for a forecast. The forecast can only be run if enough historical data is available ensuring that the risk of inaccuracy in a worst case scenario is limited.
The historical data used to analyze the pipeline movement has to be relevant to the open positions that the forecast is generated for. For example, recruitment data for sales executives cannot be used to generate reliable forecasts for the procurement of senior software developers. The pipeline forecast automatically uses relevant historical data when generating forecasts by basing all projections on the analysis context that the user defines.